A year on from Sam Bail’s previous post on building our data platform, our data team has changed significantly (we’ve almost tripled in size!) and we’ve made some key updates to our data platform that I’m excited to share in this post.
I started at Collectors in December 2022 to lead the analytics engineering and analytics functions. Upon starting, a few things were clear right off the bat. Firstly, it was evident that we had extremely talented individuals on our team, who were highly skilled across the entire data stack. Not only did they have the right skills technically, but each team member was also an expert in at least one domain within our business and a great partner to their respective stakeholders. Yet, it was also clear that we weren’t quite able to translate those skills and domain knowledge into a consistently reliable end-product that was delivering on the initial promise of our data platform.
Where were we falling short?
Our team was following all the best practices of dbt development. Our business logic was modular, our SQL was efficient, and we had better test coverage than most organizations that I’ve worked at. We even went the extra mile and wrote column level definitions. Then what was going wrong in the last mile of value delivery resulting in a disconnect with our stakeholders?
We identified a few reasons:
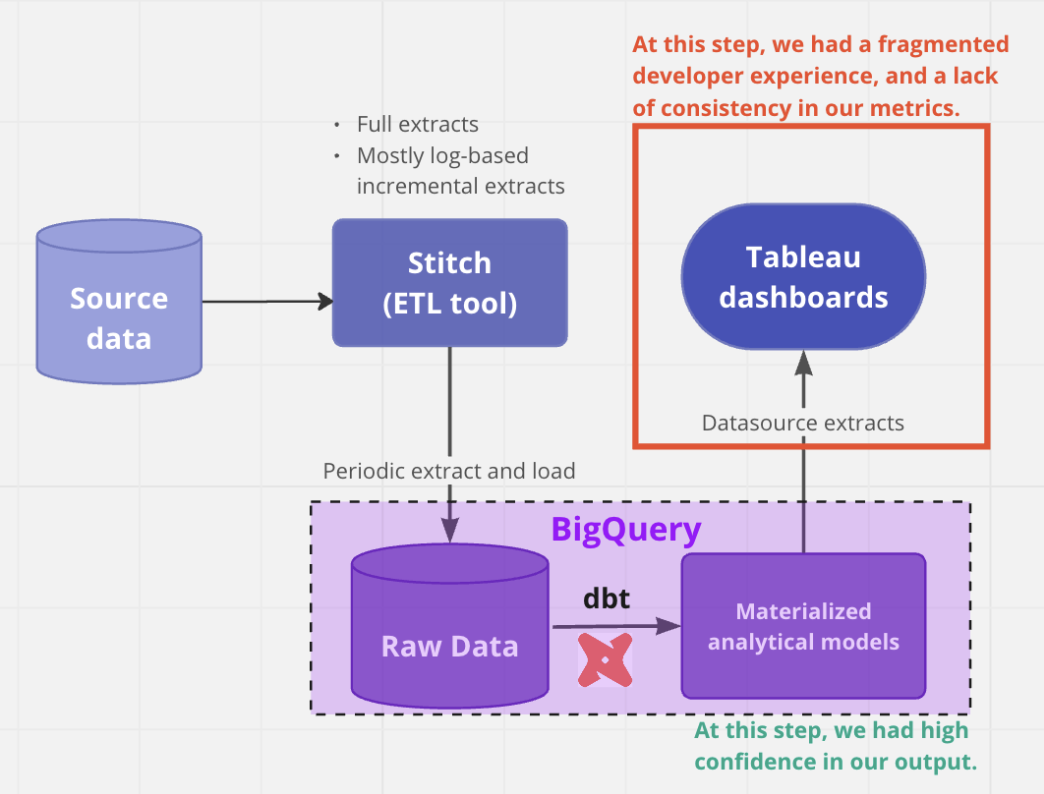
- Our metrics in Tableau were inconsistent – for (illustrative) example, even though we had modeled out our Users table effectively, Active Users was calculated differently in different dashboards. This was because metrics in Tableau are defined at the time of dashboard creation in Tableau, many times using custom calculations based on each use-case. The lack of re-usability, standardization and version control of these metrics leads to inevitable inconsistencies.
- Our end-users had a desire to dig deeper into the data and found the interface lacking for this purpose. As such, they often had to wait for a long time for our resource constrained data team to produce even simple pivots, or break-outs of metrics by attributes that already existed in our tables.
- There was no documentation in our dashboards (unless we manually added static tiles with definitions) even though this was already painstakingly written and maintained in the dbt layer.
Apart from our end-users having a suboptimal experience, our developers were having a difficult time too! This was primarily because:
- It was almost impossible to trace back any reported errors in Tableau to SQL. This made the debugging process extremely challenging when users reported discrepancies.
- Development usually had to be completed in dbt before they had to do an additional layer of development in Tableau. This created a fragmented back and forth development experience.
- We didn’t have any version control on the custom calculations within Tableau, which resulted in changing results over time that were difficult to reconcile. Given that our stakeholders sometimes (all the time) export data to Excel, this led to challenging situations.
While Tableau is an amazing visualization platform, it was evident that it wasn’t working for our use-case, and we knew we had to change something in our tooling to alleviate these issues.
A quick rant on extended sales processes for BI Tools (and how to improve them!)
When we started our vendor evaluation process, initially I thought we would end up with an established tool in the space (e.g. Looker, Sigma, Mode, etc). However, we found the evaluation process to be far too lengthy for some of the established vendors. Despite sending out our requirements ahead of time, we often found ourselves on initial discovery calls with a business development representative where we had to restate the same issues. This would be followed by another sales call with multiple representatives where we were asked numerous questions about our organization’s roadmap for 2023, before we were finally able to see a short demo. After this, we were generally quoted a hefty 6-figure sum. The solutions engineer, who we were most eager to hear from, was rarely given enough time to complete the full demo. We left some of these discussions feeling that we weren’t given adequate time to interact with the product itself, and that the sales teams had instead prioritized the discovery process for favorable licensing terms and upsell opportunities.
Lightdash has entered the chat…
Given our experiences, it was refreshing when in our first call with Lightdash, within 15 minutes of discussion we were told that the best way to proceed would be to take the tool for a spin with a free 45 day trial. During this time, the Lightdash team would support us with any questions we had.
Being a seed stage company, Lightdash was barely on our radar at the time and I had initially been hesitant to consider it. However, given the offer of the extended trial, the potential efficiencies the tool could unlock given its integrations with dbt (detailed below), and the fact that we could save up to 80% in cost with this tool, we decided to go ahead with a Proof of Concept (PoC).
We defined our criteria upfront as user stories capturing the workflows of various personas (executives, power-users, periodic viewers, developers/admins), created a list of users of each persona that would be part of the trial, and set out to test the tool with a 4 week timeline to make a decision.
How did the trial go?
It was immediately clear to us that this change in our toolkit would unlock remarkable benefits for our data team. Because Lightdash reads directly from your dbt project, the development process is seamless, allowing us to iterate rapidly.
- We could now spin up preview environments in Lightdash through the command line interface, and test our pipelines end to end. We built these previews into our continuous integration checks so that upon each pull request, developers could have a playground for data validation with their latest changes.
- We could define metrics in dbt that natively integrated with Lightdash. This means that Active Users (from our earlier example) was defined exactly once and meant the same thing everywhere it was used.
- Given any report, we could immediately access the SQL that was generating the underlying data, making debugging a simple exercise.
- All the definitions we had written previously in the dbt layer for each column were readily accessible to our end users in the platform where they consume data.
Our developers quickly started to get excited about the tool, but the main personas we had to test for were our end-users. It turned out that empowering our developers organically snowballed into stakeholder satisfaction. Because the developers were able to iterate quickly, they produced higher quality, well-tested and validated output. They shared these positive experiences and enthusiasm with their customers, who also started to recognize the improved end-product from our team. Moreover, with the easy exploration interface, our end-users were also able to easily take the definitions that we had built, and create basic reporting of their own.
At Collectors, we are encouraged to Play to Win the Game, and take risks that might lead to long-term benefits. Upon conclusion of the PoC, we felt strongly that despite Lightdash’s early stage compared to their competitors, they had built a tool for the future of the modern data stack. For this reason, we decided to take the leap and pick Lightdash as our reporting platform to be deployed across our organization.
How is it going?
It’s safe to say it’s going really well! We started this year with multiple Tableau instances and a still heavily used legacy suite of SSRS reporting. We have now fully migrated off one of those Tableau instances to Lightdash. Our second instance of Tableau is slated to be migrated by the end of this quarter. By the end of the year, we hope to have all of our reporting unified on our data platform.
So far, the feedback from our customers has been overwhelmingly positive and we have served a number of initiatives fully off of our new platform (a number of them for one of our subsidiaries, Goldin, of King of Collectibles fame on Netflix!). We hope to keep this momentum going through the rest of the year.
What’s next?
It’s an incredibly exciting time to be a member of the data team at Collectors! At the moment we’re working with what we believe is a cutting edge data stack.
We are also starting to deploy our data science team’s predictive models through dbt Python in Lightdash. In the coming months, as dbt expands its features for the Semantic Layer (and becomes compatible with BigQuery), we hope to enrich our stack with further usage of active metadata at the point of data consumption (e.g. data freshness updates in dashboards, test monitoring dashboards), upgrade our metrics implementation, add further data validation into our CI checks, and implement key alerting to help our stakeholders make data-driven decisions.
As we navigate this ever-evolving landscape of analytics, we’ll be sure to keep you updated with our learnings.